1
Derivatives Rollover Report | October 29, 2021
For Private Circulation Only
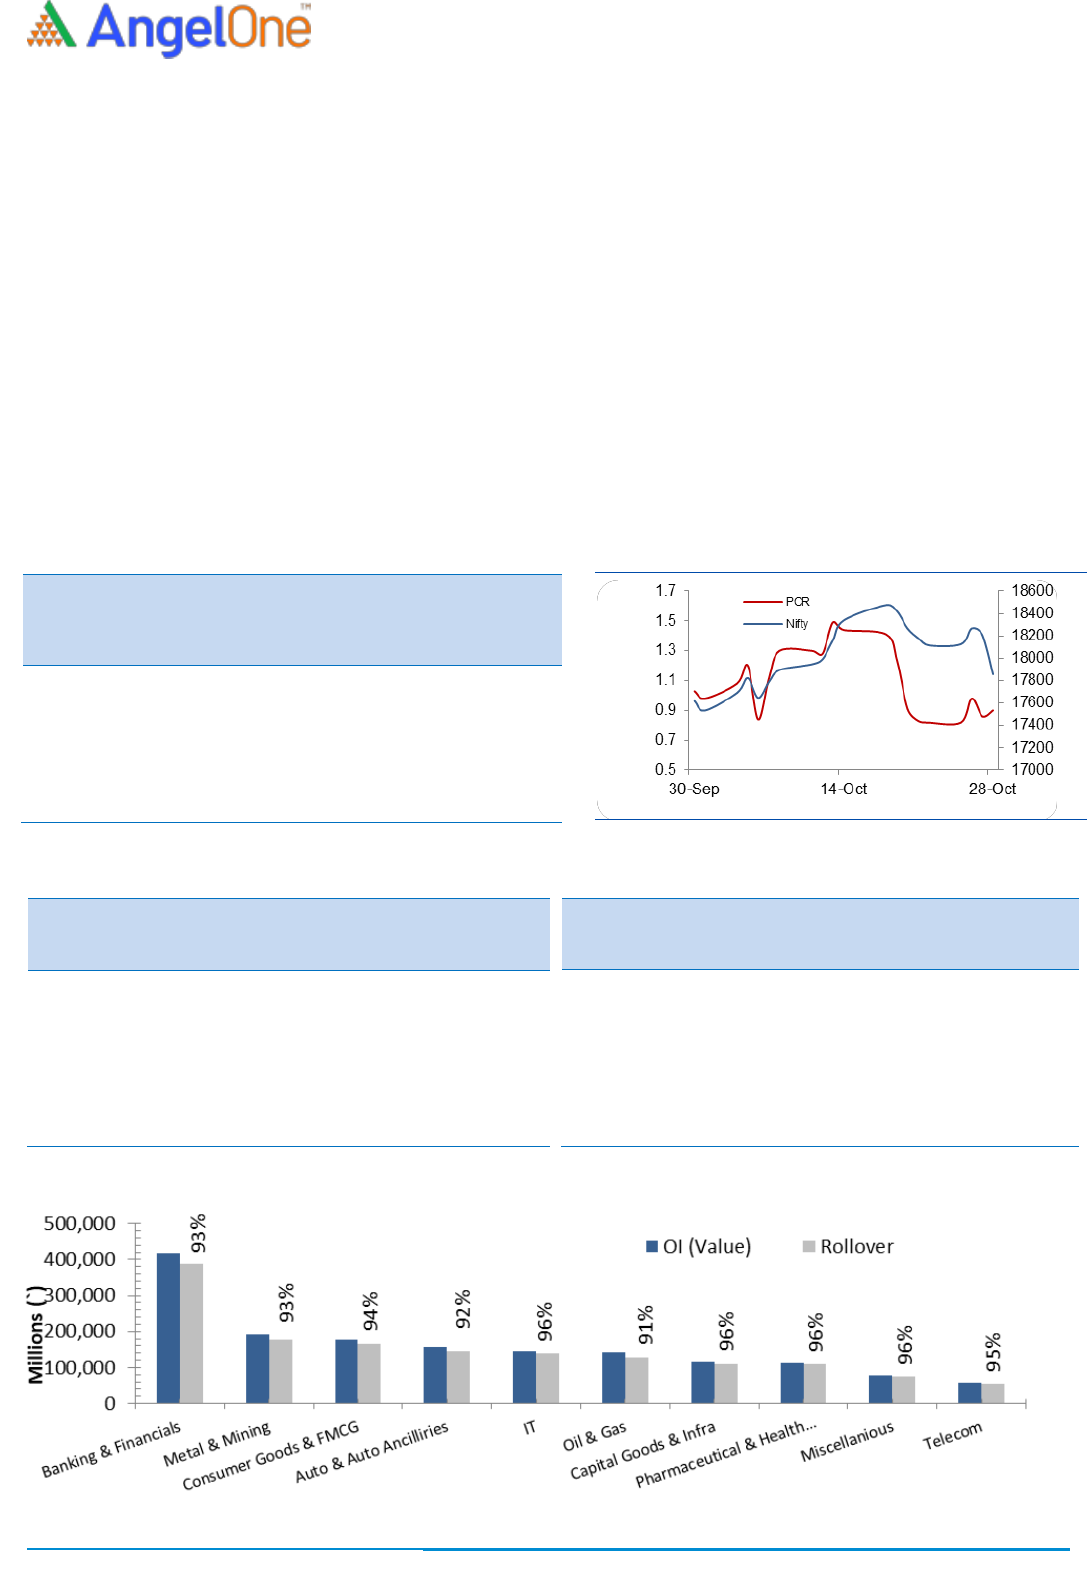
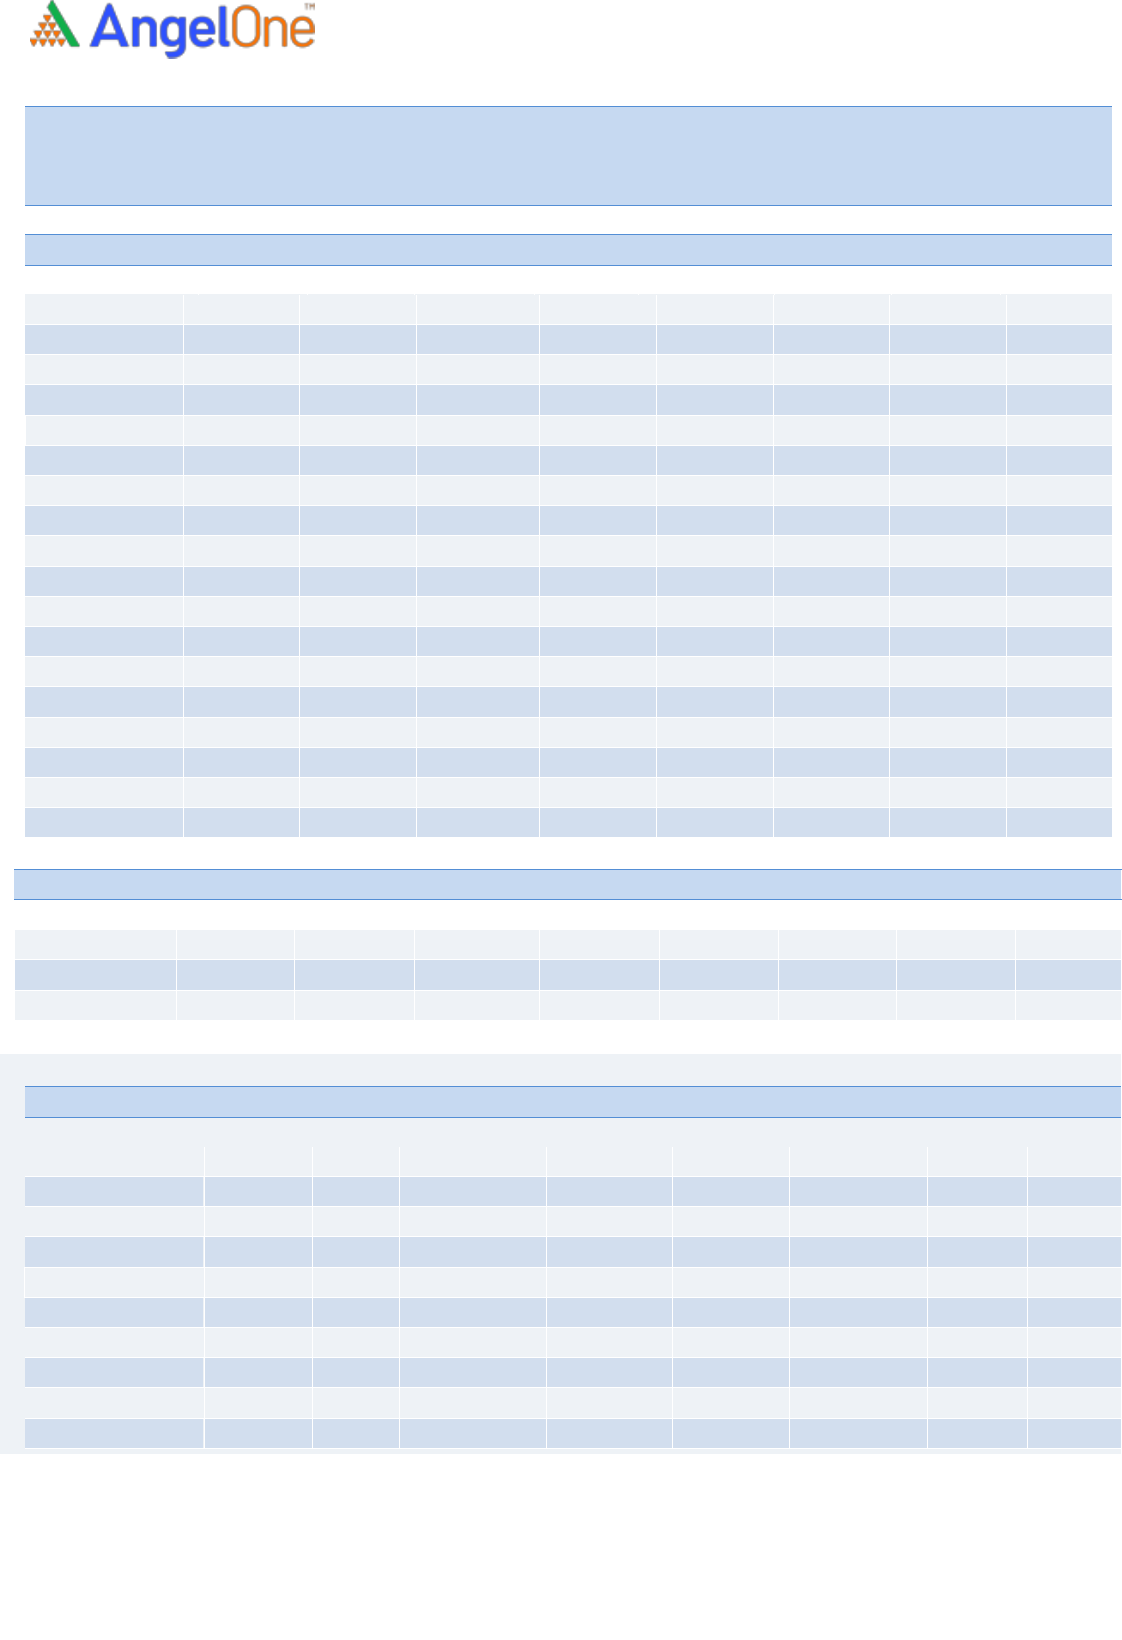
NIFTY & PCR Graph
Monthly Gainers
Scrip
Price
Price
Change
(%)
Open
Interest
Ol
Change
(%)
TATAMOTORS
483.20
44.61
83923950
(14.62)
TATAPOWER
218.30
36.74
95769000
(30.73)
BANKBARODA
98.10
19.71
158488200
(0.92)
MANAPPURAM
200.80
18.15
19578000
(6.10)
TVSMOTOR
650.90
17.85
7144200
31.28
Note: Stocks which have more than 1000 contract in Futures OI.
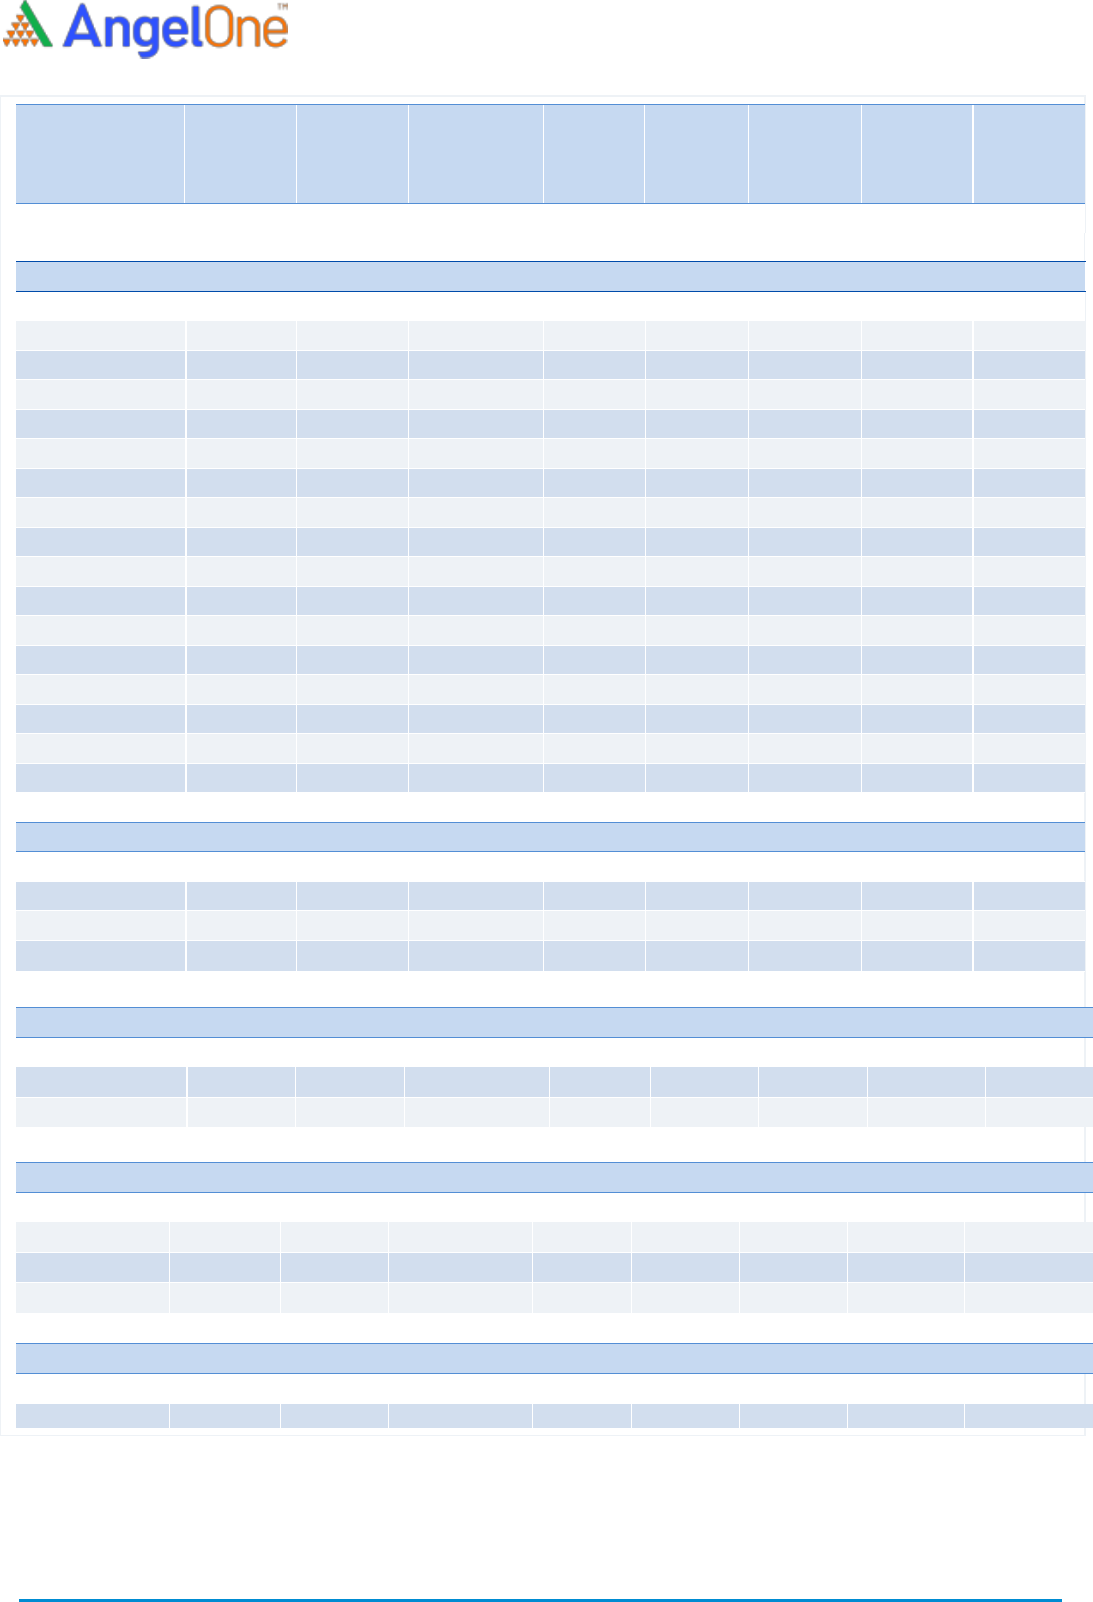
Monthly Losers
Scrip
Price
Price
Change
(%)
Open
Interest
Ol
Change
(%)
IDEA
9.75
(18.75)
750050000
(8.03)
INDIAMART
7143.95
(14.85)
216600
36.36
IPCALAB
2076.90
(14.28)
1404900
183.30
IGL
463.25
(13.47)
16997750
42.45
STAR
524.90
(11.43)
3192075
31.00
Note: Stocks which have more than 1000 contract in Futures OI.
October series was completely a roller coaster for our markets as we can easily divide it into two halves. First one being the
excellent where bulls continued their dominance to mark a fresh record high of 18604.45 but unfortunately the latter half
was not that pleasant at all, especially last two sessions of the monthly expiry. Finally, we concluded the volatile series tad
below 17900.
Now let’s take a quick glance at the F&O activities. We noticed good amount of longs during first week of the series but as
we marched beyond 18000; longs were clearly missing. During the latter half, we witnessed decent profit booking along
with short formation especially in last couple of sessions. Looking at open interest activity MoM, it seems most of the longs
have been lightened up and few shorts have been carried to the next series. Rollover for Nifty and BankNifty stood at
82.31% and 80.37%, respectively. Meanwhile, stronger hands also preferred staying light in index futures and rolled-over
shorts in stock futures segment. In equities, they were net sellers to the tune of Rs. 20,429 crores till date. As far as option
activity is concerned, traders are now eyeing 17500 put and 18000 call options. Considering the above data points, we
would maintain our cautious stance on market and would advise traders utilizing any bounce back in the vicinity of 18000 to
add fresh shorts.
Indices Change
INDEX
Price
Price
Change
(%)
Rollover
3 month
avg.
NIFTY
17857.25
1.65
82.31
80.42
BANKNIFTY
39508.95
5.52
80.37
80.98
-
-
-
-
-
-
-
-
-
-
-
-
-
-
-
Derivatives Rollover Report
For Private Circulation Only
2
Scrip
Price
Price
Change
(%)
OI Futures
OI
Change
(%)
COC (%)
PCR-OI
Rollover
(%)
Average
Rollover
(3month)
(%)
AUTO & AUTO ANCILLARIES
AMARAJABAT
685.15
(9.12)
8796000
2.41
-0.38
0.55
74.35
88.49
APOLLOTYRE
213.75
(5.75)
15120000
14.07
4.90
0.66
93.69
95.36
ASHOKLEY
141.50
5.17
36009000
(33.86)
1.85
0.52
88.08
92.14
BAJAJ-AUTO
3712.70
(3.36)
2498500
(16.80)
4.23
0.52
93.43
95.33
BALKRISIND
2491.80
(2.09)
1192400
(25.38)
0.44
4.14
77.77
86.02
BHARATFORG
767.20
3.60
9825000
(6.44)
3.07
0.46
92.58
95.14
BOSCHLTD
16781.10
7.89
142450
(4.65)
5.36
0.80
90.88
94.14
EICHERMOT
2539.60
(9.01)
4010300
9.33
6.24
0.76
89.48
92.21
ESCORTS
1539.30
3.43
7988200
18.92
5.87
0.26
97.12
95.93
EXIDEIND
172.35
(3.85)
29959200
(7.74)
2.65
0.49
95.00
94.39
HEROMOTOCO
2672.30
(6.13)
4406400
6.30
2.17
0.80
94.01
95.25
M&M
887.60
10.27
7604800
(39.71)
5.53
0.46
85.34
88.30
MARUTI
7385.90
0.43
2385700
(23.37)
2.84
0.48
97.03
95.67
MOTHERSUMI
225.10
(0.92)
30859500
(0.63)
1.45
0.65
93.52
93.97
MRF
77765.00
(2.22)
56890
16.75
2.54
0.60
96.74
97.33
TATAMOTORS
483.20
44.61
83923950
(14.62)
5.83
0.63
93.55
95.04
TVSMOTOR
650.90
17.85
7144200
31.28
-2.10
0.35
95.22
94.01
BANKING & FINANCIALS
AUBANK
1233.95
5.57
4576000
(4.79)
6.80
0.42
97.01
96.17
AXISBANK
761.35
(1.17)
46065600
31.35
5.16
0.33
97.13
96.20
BAJAJFINSV
18036.20
1.09
689250
(4.86)
3.47
0.50
89.20
84.65
BAJFINANCE
7505.20
(2.37)
4810375
14.01
3.64
0.56
96.32
94.47
BANDHANBNK
299.45
5.27
31168800
19.11
5.03
0.72
97.57
95.06
BANKBARODA
98.10
19.71
158488200
(0.92)
4.00
0.54
92.59
94.22
CANBK
194.80
12.02
47455200
(40.21)
-4.00
0.62
91.73
90.49
CHOLAFIN
610.55
7.69
9677500
(13.92)
3.21
0.23
94.73
96.88
CUB
170.35
7.44
8943500
7.13
4.99
0.37
97.07
97.04
FEDERALBNK
98.15
15.74
93500000
5.07
4.00
0.46
93.91
95.36
HDFC
2904.55
5.17
10353000
(18.86)
1.69
0.45
92.58
95.70
HDFCAMC
2634.60
(9.93)
3470400
7.20
2.53
0.72
92.36
95.54
HDFCBANK
1600.00
(0.01)
29305650
(10.57)
5.24
0.50
95.33
93.59
IBULHSGFIN
212.30
(8.75)
19998100
(46.18)
12.40
0.47
72.68
86.12
ICICIBANK
802.30
13.93
65590250
(18.02)
5.88
0.56
90.67
94.77
ICICIPRULI
619.35
(8.14)
4200000
(0.99)
3.80
0.51
96.89
88.50
IDFCFIRSTB
49.60
3.55
169841000
(1.30)
1.32
0.47
97.03
95.81
INDUSINDBK
1180.25
5.60
14566500
0.50
4.71
0.37
94.38
94.06
KOTAKBANK
2107.25
4.76
10318800
(5.51)
5.44
0.59
92.25
90.56
Derivatives Rollover Report
For Private Circulation Only
3
Scrip
Price
Price
Change
(%)
OI Futures
OI
Change
(%)
COC (%)
PCR-OI
Rollover
(%)
Average
Rollover
(3month)
(%)
L&TFH
81.50
(10.88)
72596740
16.51
4.82
0.74
96.16
95.58
LICHSGFIN
404.55
(5.75)
15192000
(17.70)
3.39
0.56
91.18
93.36
M&MFIN
186.50
0.43
20200000
(18.95)
6.32
0.51
96.10
94.54
MANAPPURAM
200.80
18.15
19578000
(6.10)
1.30
0.40
91.50
93.30
MFSL
983.90
(3.24)
2150850
(16.08)
4.85
0.41
93.26
95.69
MUTHOOTFIN
1485.55
1.92
3348000
(5.46)
2.86
0.60
96.25
95.77
NAM-INDIA
415.50
(2.93)
3083200
36.47
-5.00
0.51
95.63
93.90
PFC
134.30
(6.12)
37516200
44.21
0.97
0.56
84.64
88.56
PNB
41.50
3.11
318768000
4.49
4.73
0.50
94.33
95.42
RBLBANK
201.90
5.57
27883500
17.14
5.51
0.50
95.75
93.27
RECLTD
148.50
(6.43)
27732000
21.41
-13.47
0.58
84.27
89.46
SBIN
503.65
10.91
92493000
10.91
5.98
0.58
93.34
93.53
SRTRANSFIN
1486.30
13.66
3720400
(20.43)
-2.15
0.48
92.34
94.61
CAPITAL GOODS & INFRASTRUCTURE
ADANIPORTS
689.80
(6.78)
94922500
6.04
3.22
0.58
97.89
98.39
BHEL
68.15
5.01
115678500
(0.17)
3.84
0.48
96.15
96.01
GMRINFRA
40.05
3.89
120780000
10.00
9.84
0.55
96.01
93.02
HAVELLS
1268.25
(8.16)
3600000
(22.66)
4.64
0.36
87.96
90.66
LT
1822.45
6.73
9747400
(13.73)
5.93
0.41
91.13
94.78
SIEMENS
2170.35
1.69
1539725
(18.19)
4.64
0.63
96.14
94.98
VOLTAS
1158.60
(5.44)
2779500
(3.96)
3.72
0.42
88.86
90.32
CEMENT
ACC
2295.60
1.47
2417000
(16.78)
4.47
0.38
97.07
96.47
AMBUJACEM
390.40
(2.97)
15876000
(9.98)
1.17
0.47
95.75
90.45
GRASIM
1708.90
1.93
10428625
2.38
4.98
0.56
98.36
95.95
RAMCOCEM
1026.15
4.11
2548300
22.27
7.35
0.23
95.36
96.94
SHREECEM
28280.60
(2.47)
156600
9.00
4.05
0.34
96.82
95.75
ULTRACEMCO
6728.40
4.54
1574200
5.44
9.68
0.43
96.14
96.10
PIDILITIND
541.95
(5.51)
851000
35.73
8.05
0.33
74.71
71.65
TATACHEM
434.45
4.36
4853200
9.42
8.35
0.78
91.19
91.58
UPL
433.55
(9.37)
8288000
39.98
7.63
0.66
88.39
86.74
ASIANPAINT
738.55
3.97
5346500
1.00
14.06
0.46
84.48
81.93
COLPAL
1773.00
(6.01)
898875
4.81
12.04
0.18
86.06
85.08
DABUR
231.25
(5.80)
1755000
(51.71)
12.65
0.37
66.43
77.82
CHEMICALS & FERTILIZERS
AARTIIND
983.00
5.47
3592100
27.10
3.92
0.70
91.27
90.18
COROMANDEL
797.25
(0.16)
1690625
(22.16)
0.65
1.12
94.55
#N/A
DEEPAKNTR
2252.30
(6.55)
3248500
29.97
3.10
0.46
92.23
95.12
NAVINFLUOR
3359.75
(9.10)
623250
(1.46)
2.57
0.52
70.79
86.18
PIDILITIND
2372.95
(0.59)
2011500
(19.33)
2.72
0.40
91.22
93.67
PIIND
2959.35
(7.12)
1276250
(3.42)
3.05
1.35
96.56
94.29
TATACHEM
891.95
(3.48)
9153000
(20.17)
0.80
0.40
92.21
94.41
UPL
733.30
3.17
26760500
8.52
6.07
0.54
97.73
97.17
OIL & GAS
Derivatives Rollover Report
For Private Circulation Only
4
Scrip
Price
Price
Change
(%)
OI Futures
OI
Change
(%)
COC (%)
PCR-OI
Rollover
(%)
Average
Rollover
(3month)
(%)
Consumer Goods & FMCG
ASIANPAINT
3122.10
(4.07)
4150200
11.30
2.41
0.49
89.78
91.79
BERGEPAINT
740.20
(8.70)
5227200
10.41
4.33
0.43
95.46
96.43
BERGEPAINT
BRITANNIA
3684.35
(7.17)
1058000
(0.21)
0.87
0.59
93.45
89.66
BRITANNIA
COLPAL
1501.75
(10.17)
3362100
41.58
-13.27
0.47
95.28
89.30
COLPAL
DABUR
589.45
(4.98)
12712500
26.97
-0.55
0.42
92.61
94.23
DABUR
GODREJCP
986.00
(4.68)
4562000
(5.67)
1.52
0.44
92.25
91.12
GODREJCP
HINDUNILVR
2396.45
(11.09)
9886800
89.74
3.71
0.56
94.89
94.29
HINDUNILVR
ITC
226.00
(4.58)
224336000
28.40
5.21
0.52
96.14
91.89
ITC
JUBLFOOD
3738.80
(8.05)
1668000
3.94
4.86
0.38
92.74
85.28
JUBLFOOD
MARICO
562.80
2.32
5922000
(30.35)
-3.58
0.42
90.77
89.71
MARICO
MCDOWELL-N
897.45
4.76
16955000
0.50
7.08
0.31
97.02
95.61
MCDOWELL-N
NESTLEIND
19055.20
(2.00)
241000
0.50
4.37
0.46
95.65
85.86
NESTLEIND
TATACONSUM
810.90
(0.87)
9981900
(8.57)
1.61
0.37
93.98
94.35
TATACONS
UM
TITAN
2380.75
9.87
6929250
53.62
3.21
0.33
91.73
92.92
TITAN
UBL
1613.90
2.10
1290800
(17.16)
-13.63
0.34
93.89
93.12
UBL
COALINDIA
293.80
1.71
14714400
2
9
.
8
0
8.26
0.35
63.04
65.79
HINDALCO
88.10
30.23
34330000
(
1
3
.
3
6
)
2.22
0.61
78.46
82.59
HINDZINC
182.40
10.61
3964800
1
0
8
.
5
9
-8.52
0.34
71.17
74.01
JINDALSTEL
60.45
11.12
32228000
(
9
.
0
1
)
4.33
0.32
80.34
78.99
JSWSTEEL
1284.95
14.48
6561000
(
1
9
.
0
2
)
1.73
0.48
88.22
83.14
METALS & MINING
COALINDIA
166.05
(10.80)
65608200
5.23
-3.91
0.61
80.02
86.39
HINDALCO
470.80
(3.64)
24271350
(2.99)
5.42
0.49
93.38
82.48
JINDALSTEL
415.30
6.43
37382500
(7.69)
3.46
1.08
97.32
96.73
JSWSTEEL
669.35
(0.39)
42604650
(6.82)
3.61
0.58
98.44
98.35
NATIONALUM
98.60
4.95
91630000
3.38
0.66
0.50
90.79
87.54
NMDC
136.05
(5.32)
69525900
(36.24)
14.53
0.57
68.72
75.91
SAIL
114.20
(0.04)
163352500
1.99
-9.07
0.56
90.40
90.78
TATASTEEL
1302.15
0.71
40780450
(14.54)
2.56
0.69
96.25
96.92
VEDL
302.10
4.75
136062100
19.66
5.42
0.58
97.73
95.61
TEXTILES
ARVIND
66.40
(15.36)
5862000
(11.53)
5.92
1.09
82.52
89.16
INFORMATION TECHNOLOGY
COFORGE
4986.80
(4.91)
536000
(32.24)
-12.18
0.30
90.72
91.81
HCLTECH
1157.25
(9.27)
23699200
49.15
5.88
0.57
95.06
87.91
INFY
1705.75
2.35
37153200
9.06
1.42
0.52
97.95
93.18
LTI
6699.50
15.99
566550
(1.64)
1.97
0.38
92.03
88.35
MINDTREE
4538.20
7.55
2176000
(16.15)
7.05
0.38
95.77
92.45
MPHASIS
3277.60
4.97
1195675
(43.45)
2.71
0.24
96.94
90.00
NAUKRI
6140.85
(4.85)
856125
1.83
0.05
0.47
83.73
87.04
TCS
3437.50
(8.90)
16973100
124.21
6.02
0.49
93.58
90.25
TECHM
1524.95
9.88
11463000
(9.82)
-7.10
0.37
95.33
92.17
WIPRO
659.80
3.47
29868800
(8.11)
5.75
0.43
92.53
94.98
TELECOM
BHARTIARTL
350.55
0.39
34602594
(4.18)
7.10
0.90
89.38
87.82
IDEA
12.45
(7.43)
363300000
(10.52)
10.56
0.83
82.76
85.28
INFRATEL
276.95
1.58
6836000
3.14
10.20
0.49
84.58
83.89
TEXTILES
ARVIND
66.40
(15.36)
5862000
(11.53)
5.92
1.09
82.52
89.16
CENTURYTEX
959.75
(7.62)
3744000
5.98
-1.70
0.81
98.89
99.06
PAGEIND
20491.75
6.10
156325
9.82
-9.51
0
96.19
89.39
RAYMOND
739.95
(13.35)
2732800
4.75
7.00
1.38
97.21
96.63
SRF
3044.00
4.24
923500
9.81
8.82
0.56
95.08
96.97
MEDIA
Derivatives Rollover Report
For Private Circulation Only
5
Scrip
Price
Price
Change
(%)
OI Futures
OI
Change
(%)
COC (%)
PCR-OI
Rollover
(%)
Average
Rollover
(3month)
(%)
INFORMATION TECHNOLOGY
HCLTECH
564.00
(0.70)
22885800
(1.26)
8.14
0.58
98.56
96.78
INFY
730.55
3.77
24351600
(52.50)
2.86
0.74
55.98
79.52
MINDTREE
782.95
10.93
1041600
(14.29)
-15.63
0.59
93.13
93.37
NIITTECH
1606.65
6.68
578250
26.08
-2.03
0.46
89.76
82.99
TCS
2212.80
6.19
15671500
(17.22)
6.42
1.91
95.02
94.74
TECHM
775.75
1.00
15406800
8.21
9.05
0.65
96.29
97.15
WIPRO
249.90
3.65
18211200
(29.64)
-2.08
0.72
83.12
92.60
MISCELLANIOUS
ABFRL
256.10
3.56
9755200
2.21
2.55
0.56
85.47
#N/A
ADANIENT
1403.55
(4.84)
27815000
4.76
4.99
0.68
97.63
97.53
APOLLOHOSP
4304.40
(4.15)
2521750
(3.25)
4.30
0.50
95.80
91.43
ASTRAL
2188.40
0.85
683925
44.01
-0.63
0.30
93.25
#N/A
BATAINDIA
1973.60
10.65
1625800
(6.99)
5.64
0.28
85.06
90.23
BEL
200.85
(1.11)
19186200
(24.92)
3.58
0.37
86.31
90.31
CONCOR
657.05
(7.21)
6716211
(5.39)
-5.43
0.57
96.35
93.74
CUMMINSIND
894.90
(10.32)
2951400
70.80
0.07
0.34
96.49
81.41
HDFCLIFE
684.05
(5.80)
20711900
15.44
1.81
0.73
96.03
95.60
ICICIGI
1471.80
(7.73)
2952475
33.26
0.00
0.58
85.58
93.57
INDHOTEL
200.05
9.62
15046200
(8.77)
4.91
0.37
93.85
#N/A
INDIGO
2005.70
(0.94)
3759000
(5.48)
5.09
0.44
96.32
95.63
IRCTC
911.70
(76.10)
8193250
330.13
-2.57
0.45
83.59
86.27
LALPATHLAB
3511.25
(4.26)
615750
4.85
-23.08
0.37
91.70
92.95
LTTS
4658.15
(1.20)
630400
32.16
-1.97
0.29
92.95
90.66
METROPOLIS
2839.15
5.11
655800
41.83
-45.04
0.37
93.45
#N/A
SBILIFE
1172.10
(3.81)
8724000
13.26
5.53
0.50
90.37
76.79
TRENT
1009.55
(1.96)
1987950
43.41
4.93
0.41
84.45
90.40
MEDIA
PVR
1682.65
4.82
2834755
6.86
6.07
0.29
94.12
94.46
SUNTV
548.20
7.51
9945000
(9.41)
7.53
0.31
80.43
84.73
ZEEL
297.90
(2.09)
73497000
56.15
2.63
0.69
96.75
93.35
IGL
506.15
(1.77)
5178250
(23.81)
7.68
1.13
97.21
91.91
IOC
91.70
(9.79)
62803000
(12.25)
9.18
0.66
93.34
91.89
MGL
1142.20
(4.95)
1020000
(34.79)
1.01
0.96
95.18
90.39
ONGC
102.90
(13.13)
38269000
(13.29)
9.20
0.69
92.19
84.88
PETRONET
222.20
(14.51)
18006000
4.88
6.85
0.92
96.78
95.76
RELIANCE
2008.90
(6.90)
26297500
(1.73)
9.11
0.63
97.62
95.78
BPCL
470.70
11.69
44681400
8.98
8.89
0.51
93.84
91.32
BATAINDIA
1444.10
8.68
1488850
(10.54)
-2.88
0.42
93.06
94.61
BEL
115.85
1.49
22602000
(2.49)
10.21
0.44
97.34
96.42
MCX
659.60
(6.88)
2102100
(7.23)
11.16
0.79
93.26
90.88
MCX
1111.60
2.65
1348000
12.33
-3.27
0.66
92.87
80.54
OIL & GAS
BPCL
416.00
(3.96)
30355200
(18.15)
-14.87
0.70
81.11
88.40
GAIL
147.60
(7.66)
41187200
(14.81)
1.33
0.64
90.17
94.43
GUJGASLTD
593.95
(7.32)
4485000
(31.77)
-0.44
0.69
94.62
93.22
HINDPETRO
318.35
5.94
14715000
(25.54)
5.35
0.32
79.31
90.15
IGL
463.25
(13.47)
16997750
42.45
1.13
0.69
90.78
92.96
IOC
125.90
0.12
32246500
(14.83)
-27.86
0.53
85.86
88.96
MGL
976.10
(10.35)
4036200
26.83
-1.13
0.68
91.25
95.31
ONGC
150.60
3.97
50558200
(10.51)
3.47
0.50
81.73
80.79
PETRONET
225.35
(5.93)
16620000
(29.87)
-36.27
0.62
73.08
88.48
RELIANCE
2609.40
3.53
29978000
7.39
5.39
0.46
96.54
93.15
AUROPHARMA
1037.15
6.60
8765250
(5.00)
7.85
0.51
97.81
95.86
BIOCON
383.45
(3.23)
17434000
0.03
5.93
0.71
86.18
89.52
CADILAHC
629.55
11.44
22301400
43.30
6.29
0.51
95.72
93.45
CIPLA
946.80
3.82
10505950
(19.23)
6.89
0.53
91.10
89.74
OIL & GAS
Derivatives Rollover Report
For Private Circulation Only
6
Scrip
Price
Price
Change
(%)
OI Futures
OI
Change
(%)
COC
(%)
PCR-OI
Rollover
(%)
Average
Rollover
(3month)
(%)
PHARMACEUTICAL
ALKEM
3709.20
(7.30)
518000
32.08
5.52
0.76
98.89
96.17
APLLTD
746.25
(5.64)
2335300
(1.26)
2.63
0.87
98.29
95.46
AUROPHARMA
679.80
(6.64)
13230100
(8.53)
2.11
0.68
91.72
94.03
BIOCON
338.40
(7.03)
18425300
11.56
2.12
0.61
95.69
94.97
CADILAHC
493.35
(11.00)
18860600
3.95
4.37
0.66
95.71
94.81
CIPLA
895.40
(9.18)
11742900
49.52
5.34
0.58
95.62
89.06
DIVISLAB
5128.20
6.55
1792200
(25.01)
1.71
0.43
96.38
95.74
DRREDDY
4588.00
(6.40)
2804625
5.08
5.12
0.84
96.25
96.42
GLENMARK
494.65
(3.56)
8200650
11.49
0.53
0.56
98.24
96.39
GRANULES
310.30
(3.32)
10174200
(9.79)
-0.21
0.33
96.60
94.23
LUPIN
882.20
(7.65)
9299000
(20.01)
0.67
0.70
94.64
94.69
PEL
2596.75
(0.49)
3622850
(17.94)
-0.13
0.75
96.49
96.92
PFIZER
4996.30
(10.93)
192875
(16.64)
0.40
0.47
79.74
90.67
STAR
524.90
(11.43)
3192075
31.00
5.61
0.49
94.39
#N/A
SUNPHARMA
809.95
(1.51)
29563800
(11.63)
3.79
0.57
96.76
92.00
TORNTPHARM
2782.65
(10.01)
671250
(7.73)
-0.33
0.50
97.64
97.11
POWER
NTPC
137.25
(3.14)
36098100
(27.57)
-0.95
0.42
80.00
82.81
POWERGRID
185.00
(2.76)
19294794
(45.23)
-6.31
0.62
63.87
77.21
TATAPOWER
218.30
36.74
95769000
(30.73)
1.79
0.69
91.60
93.79
REAL ESTATE
DLF
398.05
(5.07)
36111900
14.53
4.93
0.78
96.52
95.10
GODREJPROP
2279.10
(1.19)
1844050
(21.78)
4.97
0.51
94.35
92.99
TELECOM
BHARTIARTL
691.20
(0.04)
65940218
(9.37)
2.84
0.73
94.98
88.49
IDEA
9.75
(18.75)
750050000
(8.03)
6.72
0.54
94.55
81.89
INDUSTOWER
274.05
(10.75)
15019200
23.57
7.17
0.48
89.77
89.71
TEXTILES
SRF
2123.95
(81.25)
3295625
390.24
2.31
0.59
93.84
91.96
POWERGRID
208.95
8.77
31196000
46.96
7.85
0.98
86.83
81.73
TATAPOWER
69.25
(0.22)
53307000
(2.47)
11.39
0.95
92.66
92.57
TORNTPOWER
280.50
13.36
4017000
90.20
-26.19
1.31
84.48
88.46

Derivatives Rollover Report
For Private Circulation Only
7
Technical and Derivatives Team:
Sameet Chavan Chief Analyst – Technical & Derivatives sameet.chavan@angelone.in
Rajesh Bhosale Technical Analyst rajesh.bhosle@angelone.in
Sneha Seth Derivatives Analyst sneha.seth@angelone.in
Research Team Tel: 022 - 39357600 (EXTN - 6844) Website: www.angelbroking.com
DISCLAIMER
Angel Broking Limited (hereinafter referred to as “Angel”) is a registered Member of National Stock Exchange of India
Limited, Bombay Stock Exchange Limited and Metropolitan Stock Exchange Limited. It is also registered as a Depository
Participant with CDSL and Portfolio Manager and Investment Adviser with SEBI. It also has registration with AMFI as a
Mutual Fund Distributor. Angel Broking Limited is a registered entity with SEBI for Research Analyst in terms of SEBI
(Research Analyst) Regulations, 2014 vide registration number INH000000164. Angel or its associates has not been
debarred/ suspended by SEBI or any other regulatory authority for accessing /dealing in securities Market. Angel or its
associates/analyst has not received any compensation / managed or co-managed public offering of securities of the
company covered by Analyst during the past twelve months.
This document is solely for the personal information of the recipient, and must not be singularly used as the basis of any
investment decision. Nothing in this document should be construed as investment or financial advice. Each recipient of
this document should make such investigations as they deem necessary to arrive at an independent evaluation of an
investment in the securities of the companies referred to in this document (including the merits and risks involved), and
should consult their own advisors to determine the merits and risks of such an investment.
Reports based on technical and derivative analysis center on studying charts of a stock's price movement, outstanding
positions and trading volume, as opposed to focusing on a company's fundamentals and, as such, may not match
with a report on a company's fundamentals. Investors are advised to refer the Fundamental and Technical Research
Reports available on our website to evaluate the contrary view, if any.
The information in this document has been printed on the basis of publicly available information, internal data and
other reliable sources believed to be true, but we do not represent that it is accurate or complete and it should not be
relied on as such, as this document is for general guidance only. Angel Broking Limited or any of its affiliates/ group
companies shall not be in any way responsible for any loss or damage that may arise to any person from any
inadvertent error in the information contained in this report. Angel Broking Limited has not independently verified all the
information contained within this document. Accordingly, we cannot testify, nor make any representation or warranty,
express or implied, to the accuracy, contents or data contained within this document. While Angel Broking Limited
endeavors to update on a reasonable basis the information discussed in this material, there may be regulatory,
compliance, or other reasons that prevent us from doing so.
This document is being supplied to you solely for your information, and its contents, information or data may not be
reproduced, redistributed or passed on, directly or indirectly.
Neither Angel Broking Limited, nor its directors, employees or affiliates shall be liable for any loss or damage that may
arise from or in connection with the use of this information.
Derivative Research Team derivatives.desk@angelbroking.com
